Air Traffic By The Numbers







Last updated: Monday, September 9, 2024
May 2024 Air Traffic By the Numbers
FAA Contributors to ATO By the Numbers
● Air Traffic Organization (ATO) o AJR - System Operations ■ AJR-G Performance Analysis ■ AJR-B Flight Service o AJI - Safety and Technical Training Services ■ AJI-3 Policy and Performance o AJM – Program Management Organization ■ AJM-33 Aviation Weather & Aero Services o AJT – Air Traffic Services o AJV – Mission SupportServices ■ AJV-A370 US NOTAM Operations Team
● Non-ATO o AOC – Office of Communications o ABP-230 – Data Analysis and Reporting Services Branch o APO – Aviation Policy & Plans o AST – Office of Commercial Space Transportation o AVS – Aviation Safety
Data Sources
Database Name¹ Owned/ Managed by²
1. Aviation System Performance Metrics (ASPM)¹ AJR-G²
2. Operations Systems Network (OPSNET)¹ AJR-G (archive), AJM and AJW²
3. National Traffic Management Log (NTML)¹ AJR-G (archive), AJM and AJW²
4. Traffic Flight Management System (TFMS)¹ AJR-G (archive), AJM and AJW²
5. National Offload Program (NOP)¹ AJR-G (archive) and AIT²
6. U.S. Civil Airmen Statistics¹ APO²
7. Runway Incursion Data¹ AVS²
8. BTS T-100 Market and Segment Data¹ Bureau of Transportation Statistics²
FAA Air Traffic Organization • System Operations Services Page ii Air Traffic By the Numbers
Table of Contents
FAA Contributors to ATO By the Numbers ...........................ii Data Sources ............................... ii Table of Contents ....................... iii Introduction ................................. v Air Traffic Organization Leadership ................................... 1 Section 1. FAA Air Traffic Management System Overview for FY2023 ..... 2 Class B Airspaces (Airspace around Busiest US Airports) ....... 3 Airport Operations ....................... 4 Pilot Certificates .......................... 5 Commercial Flight and Available Seat Mile (ASM) Trends .............. 6 Instrument Flight Rule (IFR) and Visual Flight Rule (VFR)* Flights across the NAS ........................... 7
Section 2. Demand and Efficiency in the NAS .............................................. 8 Core 30 Airport Operations......... 9 Stand-Alone Terminal Radar Control (TRACON) Facilities ..... 10 Air Route Traffic Control Centers (ARTCC) and Combined Control Facilities (CCF) .......................... 11 Number of IFR Flights at Any Given Minute during Peak Operational Times ......................................... 12 Average Hourly Capacity (Called Rate) at Core 30 Airports ......... 13 Average Daily Capacity (ADC) - Based on Called Rates at Core 30 Airports ................................ 14
Section 3. NAS Delay, Diversions, Go-Arounds, and Cancel ........... 15 Counts of NAS Delay at Core 30 Airports ...................................... 16 Delays by Category .................... 17 Diversions at Core 30 Airports .. 18 Go-Arounds at Core 30 Airports .19 Cancellations at Core30Airports.20
Section 4. Traffic Management Initiatives...21 Ground Delay Programs at Core 30 Airports ................................. 22 Ground Stops at Core 30 Airports ................................. 23 Airspace Flow Programs by Center .................................... 24 Holdings by Center .................... 25
Section 5. Safety Metrics ........................... 26 Runway Incursions at Core 30 Airports ...................................... 27 Incursions by Type at Core 30 Airports, FY2023 ....................... 28 Loss of Standard Separation Count, by Center ....................... 29
FAA Air Traffic Organization • System Operations Services Page iii Air Traffic By the Numbers
Section 6. Other ATO Topics ..................... 30 Flight Service Stations .............. 31 FAA Flight Services ................... 32 Commercial Space Launch Activity .......................... 33 U.S. Spaceports ......................... 33 Appendix I. Facility Codes ........ 34 Appendix II. Other FAA Airport Lists ............................... 35 Appendix III. Historical Airport and Center Operations .............. 38 Glossary of Terms ..................... 38 Acknowledgements .................. 47
FAA Air Traffic Organization • System Operations Services Page iv Air Traffic By the Numbers
Introduction Air Traffic By the Numbers, or the ATO Fact Book, is a source book containing annual U.S. airport and air traffic control operations and performance data from the Federal Aviation Administration (FAA). It also includes information on air passenger travelers, runway incursions, commercial space launch activity, the economic impact of aviation, and so on.
The ATO Fact Book, first published by the Office of Performance Analysis, Air Traffic Organization (ATO) of the FAA in 2017, is updated annually, with data now current up until FY2023. This document represents the eighth edition of Air Traffic By the Numbers.
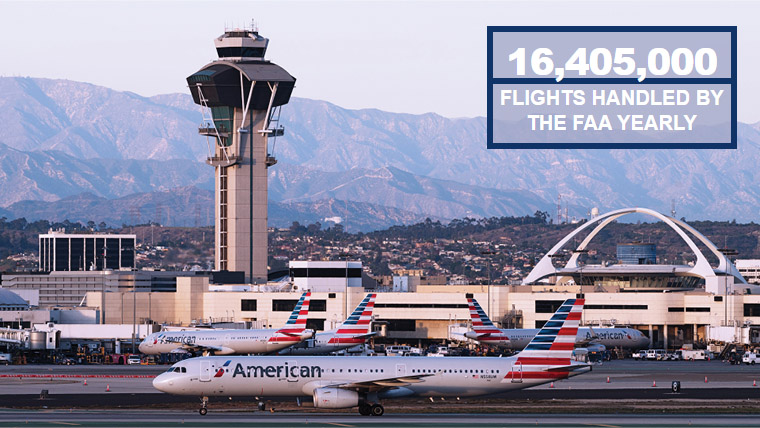
The storyline behind this year’s Fact Book is the ongoing recovery from the impact of the COVID-19 global pandemic on air traffic.This impact, which began during FY2020 (specifically, March 2020) and continues through FY2023, is waning as air traffic continues to return to pre-pandemic levels. The format of this edition is unchanged from last year. Section 1 includes some overall aviation- related statistics. NAS demand and efficiency measures appear in Section 2. Delay, diversion, go- around, and cancellation information follow in Section 3. Section 4 includes the latest data on various traffic management initiatives (TMI). Updated safety metric results are reported in Section 5. Other ATO Topics of interest, such as flight service and commercial space, are available in Section 6. The ATO Fact Book also includes historical annual airport tower and center operations for 1946-2023 (Appendix III). Below are brief selected results for FY2023. ● Core 30 airport operations rose by 3.8 percent, to 12.2 million; operations handled by stand-alone TRACONS rose by 1.8 percent, to 19.2 million, while operations handled by centers rose by 2.1%, to 42.3 million (Section 2). Airport, TRACON, and center operations were higher before the pandemic, at 13.2 million, 20.3 million, and 43.7 million,respectively. ● IFR flights in the U.S. rose by 1.8 percent, to 15.7 million (Section 1). Before the pandemic, IFR flights numbered 16.4 million in FY2019. ● The number of passengers flown by air carriers increased by 13.9 percent, to 1,044.8 million (or about 1 billion) in FY2023 (Section 1).This is slightly below the pre-pandemic level of 1,057.6 million passengers in FY2019.
● The number of air traffic controllers increased by 1.2 percent, to 13,853 (in Section 1). ● The number of pilot certificates increased by 6.6 percent in CY2023 to 806,939; and remote (or drone) pilot certificates increased by 21.2 percent, to 368,633 (Section 1).
This publication benefited from the contributions of many offices and . individuals throughout the Air Traffic Organization and the Federal Aviation Administration. As always, we thank~ everyone who participated in this effort.
~System Events & Analysis Group (AJR-G3) ~Office of Performance Analysis ~System Operations Services ~Air Traffic Organization ~Federal Aviation Administration ~U.S. Department of Transportation May 2024 FAA Air Traffic Organization • System Operations Services Page v Air Traffic By the Numbers
Air Traffic Organization Leadership
FAA Air Traffic Organization • System Operations Services Page 1 Air Traffic By the Numbers
Section 1. FAA Air Traffic Management System Overview for FY2023
ATO Program and Financing Operations Budget Estimate (in $billions) (FY2023) $8.8 Flights Handled 15,712,724 Scheduled 9,278,293 Unscheduled 6,434,431 Airspace (in millions of sq mi)...............................29.4 Oceanic 24.1 Domestic 5.3
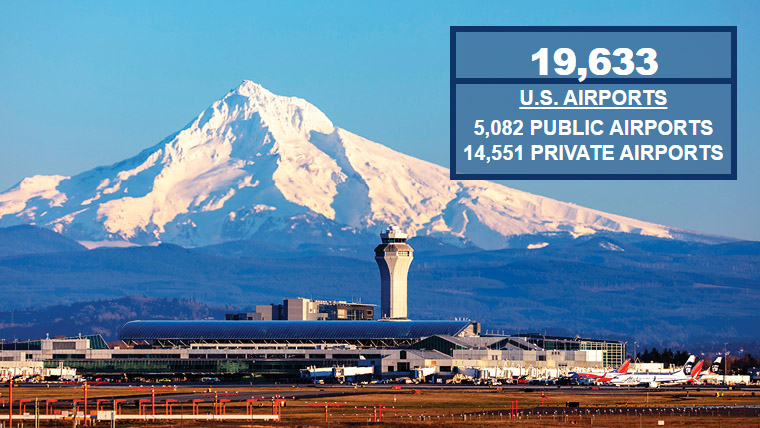
Airports 19,623 Public Use Airports 5,165 Private Use Airports 14,458
Federal Air Traffic Control Facilities 1/ .................313 Stand-Alone ATC Tower Facilities 142 Stand-Alone TRACON Facilities 25 Combined ATC Tower/ TRACON Facilities 2/ 121 Centers and Combined Control Facilities 25 ARTCC 21 CCFs 4 Contract Air Traffic Control Towers 3/ 262
NAVAIDS 12,799
Alaska Weather Cameras 238
Controllers 13,853
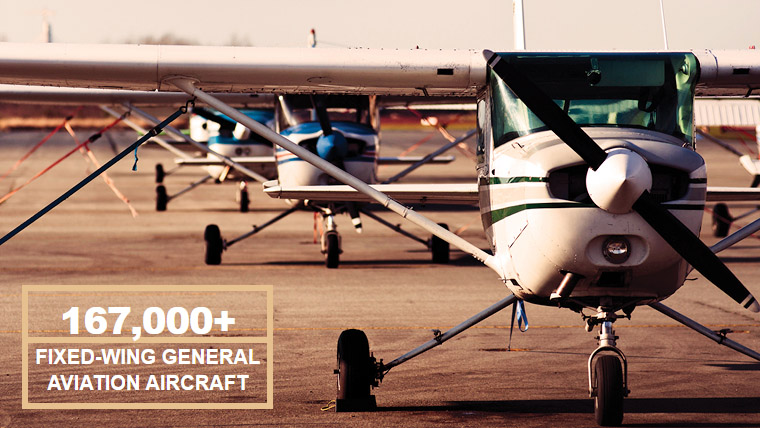
GA Aircraft (CY2022) 209,540 Fixed Wing 164,567 Rotorcraft 9,769 Experimental/Lightcraft/ Other 35,204
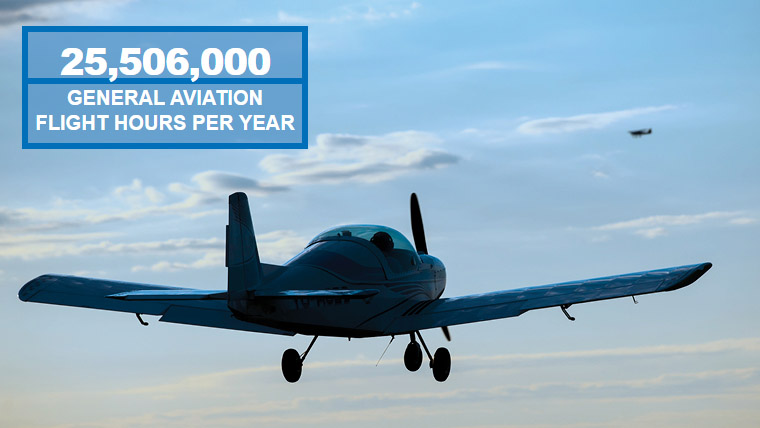
GA Flight Hours (CY2022) 26,953,000
1/ These facility counts are consistent with page 13 of the 2023 FAA Air Traffic Controller Workforce Plan (https://www.faa.gov/air_traffic/publications/controller_staffing/). For FY2023, stand- alone towers rose from 139 to 142 and combined TRACONs fell from 124 to 121 as three combined TRACONs were consolidated into two other existing TRACONs.
2/ Combined ATC towers and TRACONs are located within the same building.
3/ Includes two new contract towers introduced during FY2023.
Sources:
ATO Program and Financing: U.S. Dept. of Transportation, Budget Estimates: FY2024, Federal Aviation Administration, Exhibit II-2.
Flights Handled: Federal Aviation Administration, Air Traffic Organization, Office of Performance Analysis (AJR-G), December 15, 2023; Innovata, Flight Schedule Database, accessed April 1, 2024.
Airspace: Federal Aviation Administration, Air Traffic Organization, Office of Performance Analysis (AJR-G).
Airports and NAVAIDS: Federal Aviation Administration, Air Traffic Organization, Airport Safety, Airport Data and Information Portal (ADIP), March 29, 2024. https://adip.faa.gov/agis/public/#/airportSearch/advanced; Federal Aviation Administra- tion, Air Traffic Organization, Technical Operations (AJW), Monthly NAS Operational Facilities Inventory, October 1, 2023. https://my.faa.gov/org/linebusiness/ato/operations/ajw1/noag/nas_policy/fsep/media/NOF.pdf
ATC Towers, TRACONs, and En Route Centers & CCFs: Federal Aviation Administration, Air Traffic Organization, Air Traffic Services (AJT).
Alaska Weather Cameras: Federal Aviation Administration, Air Traffic Organization, Aviation Weather & Aeronautical Services (AJM33), FAA Aviation Weather Cameras, accessed January 30, 2024. https://weathercams.faa.gov
Controllers: Federal Aviation Administration, Office of Finance and Management, Data Analysis and Reporting Services Branch (ABP230), Air Traffic Controller and Academy Movement Report - September FY2023, September 29, 2023.
GA Aircraft and GA Flight Hours: Federal Aviation Administration, Aviation Safety (AVS), General Aviation and Part 135 Activity Surveys – CY2022, Tables 1.1 and 1.3, January 8, 2024. https://www.faa.gov/data_research/aviation_data_statistics/general_aviation/
FAA Air Traffic Organization • System Operations Services Page 2 Air Traffic By the Numbers
Class B Airspaces (Airspace around Busiest US Airports)
Note: Airspaces accurately represented for coverage area 29 places only.
FAA Air Traffic Organization • System Operations Services Page 3 Air Traffic By the Numbers
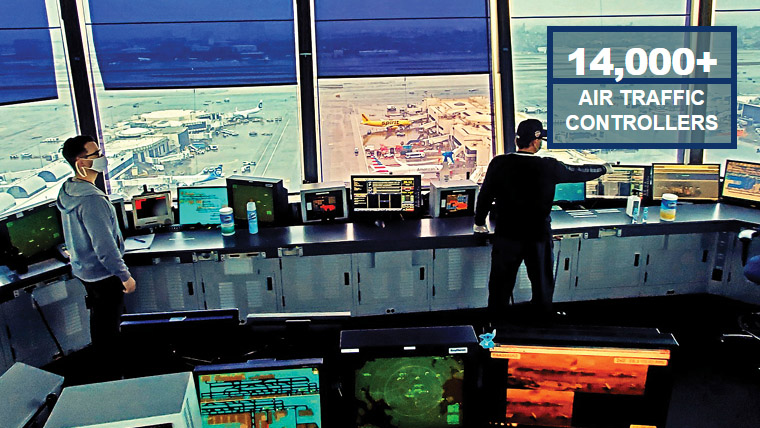
Air Traffic Controllers As of the end of FY2023, the FAA air traffic controller total was 13,853 , an increase from 13,693 at the end of FY2022.
FY2022¹ FY2023² Academy Graduate (AG)643¹ 762² Developmental (D1) 207¹ 144² Developmental (D2) 596¹ 477² Developmental (D3) 451¹ 487² Certified Professional (CPC) 10,578¹ 10,593² Certified Professional in training (CPCIT) 943¹ 985²
Controllers 13,418¹ 13,448² Academy 275¹ 405² Total Head Count 13,693¹ 13,853²
Among Core 30 airports, Philadelphia (PHL), Miami (MIA), and Charlotte (CLT) reported large headcounts because these are combined ATCT TRACONs. PHL had the highest net gain of controllers at 11, while Fort Lauderdale (FLL) and Washington Dulles (IAD) had the highest net losses at 4. (See, Appendix I for explanations of the Core 30 airport and Center codes.)
Source: Federal Aviation Administration, Office of Finance and Management, Data Analysis and Reporting Services Branch (ABP-230), Air Traffic Controller and Academy Movement Report - September FY2023, September 29, 2023.
FAA Air Traffic Organization • System Operations Services Page 4
Air Traffic By the Numbers
Pilot Certificates
The table below shows the number of pilot certificates held by age group (upper panel below) and by year (lower panel). The upper panel illustrates that student, commercial , and remote (or drone) pilots tend to be younger, while airline transport pilots tend to be older. The lower panel informs us that the number of total active pilot certificates held in the U.S. increased by 6.6 percent, from 756,927 in CY2022 to 806,939 in CY2023, mainly due to an increase in student pilot certificates from 280,582 to 316,470. Further, the number of remote pilot certifica- tions (which began in August 2016) increased by 21.2 percent, from 304,256 in 2021 to 368,633 in 2023. Note the pilot total does not include flight instructors and remote pilots.)
Estimated Active Pilot Certificates Held by Category and Age Group of Holder, as of December 31, 2023
Type of Pilot Certificates
By Age Group¹; Total²; Student³; Sport⁴; Recreational⁵; Private 1/⁶; Commercial 1/⁷; Airline Transport 1/⁸; Certified Flight Instructor 2/⁹; Remote Pilot 2/¹⁰ .
Total¹; 806,939²; 316,470³; 7,144⁴; 72⁵; 180,233⁶; 122,282⁷; 180,738⁸; 131,577⁹; 368,633¹⁰.
14-15¹; 820²; 820³; 0⁴; 0⁵; 0⁶; 0⁷; 0⁸; 0⁹; 0¹⁰.
16-19¹; 34,049²; 25,915³; 8⁴; 2⁵; 7,513⁶; 611⁷; 0⁸; 214⁹; 6,146¹⁰.
20-24¹; 88,348²; 47,689³; 55⁴; 1⁵; 22,074⁶; 16,584⁷; 1,945⁸; 10,061⁹; 22,527¹⁰.
25-29¹; 100,033²; 55,336³; 139⁴; 1⁵; 15,906⁶; 19,045⁷; 9,606⁸; 15,292⁹; 45,026¹⁰.
30-34¹; 91,183²; 50,706³; 237⁴; 5⁵; 13,967⁶; 12,937⁷; 13,331⁸; 13,488⁹; 52,460¹⁰.
35-39¹; 81,434²; 38,204³; 316⁴; 2⁵; 14,049⁶; 10,836⁷; 18,027⁸; 14,228⁹; 52,022¹⁰.
40-44¹; 71,879²; 28,240³; 372⁴; 1⁵; 13,297⁶; 8,964⁷; 21,005⁸; 13,927⁹; 45,357¹⁰.
45-49¹; 57,904²; 19,275³; 396⁴; 4⁵; 11,084⁶; 6,835⁷; 20,310⁸; 11,521⁹; 36,328¹⁰.
50-54¹; 58,429²; 15,208³; 486⁴; 5⁵; 12,666⁶; 7,203⁷; 22,861⁸; 11,565⁹; 32,762¹⁰.
55-59¹; 58,875²; 12,030³; 777⁴; 4⁵; 13,920⁶; 7,360⁷; 24,784⁸; 10,642⁹; 26,214¹⁰.
60-64¹; 57,140²; 9,657³; 964⁴; 11⁵; 16,229⁶; 7,768⁷; 22,511⁸; 9,520⁹; 21,238¹⁰.
65-69¹; 44,130²; 6,535³; 1,133⁴; 12⁵; 16,347⁶; 7,636⁷; 12,467⁸; 8,123⁹; 14,887¹⁰.
70-74¹; 29,963²; 3,820³; 999⁴; 11⁵; 12,077⁶; 6,563⁷; 6,493⁸; 5,983⁹; 8,447¹⁰.
75-79¹; 19,618²; 2,016³; 717⁴; 9⁵; 7,005⁶; 5,497⁷; 4,374⁸; 4,386⁹; 3,814¹⁰.
80 & over¹; 13,134²; 1,019³; 545⁴; 4⁵; 4,099⁶; 4,443⁷; 3,024⁸; 2,627⁹; 1,405¹⁰.
By Year¹ ; Total²; Student³; Sport⁴; Recreational⁵; Private 1/⁶; Commercial 1/⁷; Airline Transport 1/⁸; Certified Flight Instructor 2/⁹; Remote Pilot 2/¹⁰ .
2015¹ ; 590,038²; 122,729³; 5,482⁴; 191⁵; 186,786⁶; 116,291⁷; 158,559⁸; 102,628⁹; N/Ap¹⁰ .
2016¹ ; 584,361²; 128,501³; 5,889⁴; 178⁵; 174,517⁶; 112,056⁷; 163,220⁸; 104,382⁹; 20,362¹⁰.
2017¹ ; 609,306²; 149,121³; 6,097⁴; 157⁵; 174,516⁶; 114,186⁷; 165,228⁸; 106,692⁹; 69,166¹⁰.
2018¹; 633,316²; 167,804³; 6,246⁴; 147⁵; 175,771⁶; 115,776⁷; 167,572⁸; 108,564⁹; 106,321¹⁰.
2019¹; 664,563²; 197,665³; 6,467⁴; 130⁵; 173,080⁶; 116,572⁷; 170,649⁸; 113,445⁹; 160,302¹⁰.
2020¹; 691,689²; 222,629³; 6,643⁴; 107⁵; 172,945⁶; 119,245⁷; 170,120⁸; 117,558⁹; 206,322¹⁰.
2021¹; 720,603²; 250,197³; 6,801⁴; 86⁵; 173,606⁶; 119,827⁷; 170,086⁸; 121,270⁹; 254,587¹⁰.
2022¹; 756,927²; 280,582³; 6,957⁴; 80⁵; 176,328⁶; 119,832⁷; 173,148⁸; 125,075⁹; 304,256¹⁰.
2023¹; 806,939²; 316,470³; 7,144⁴; 72⁵; 180,233⁶; 122,282⁷; 180,738⁸; 131,577⁹; 368,633¹⁰.
1/ Includes pilots with an airplane and/or a helicopter and/or a glider and/or a gyroplane certificate. Pilots with multiple ratings are reported under highest rating. For example a pilot with a private helicopter and commercial airplane certificates are reported in the commercial category.
2/Not included in total active pilots.
N/Ap Not applicable.
Source: Federal Aviation Administration, Office of Aviation Policy and Plans (APO), U.S. Civil Airmen Statistics, 2023, Table 12, March 12, 2024. https://www.faa.gov/data_research/aviation_data_statistics/civil_airmen_statistics/
FAA Air Traffic Organization • System Operations Services Page 5 Air Traffic By the Numbers
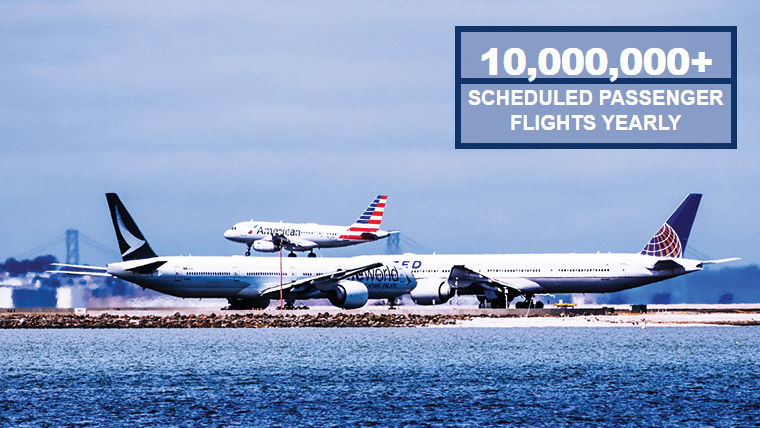
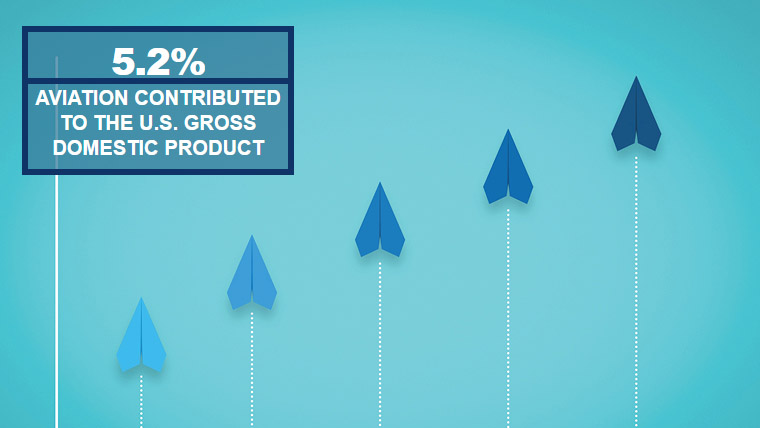
Commercial Flight and Available Seat Mile (ASM) Trends Commercial air passenger travel continues to recover from the impact of the COVID-19 pandemic. Thus far, the pandemic affected travel numbers from FY2020 through FY2023 (graph and first table below). From FY2022 to FY2023, the number of scheduled commercial flights rose by 4 % to 10.2 million (graph)and the number of passengers rose by 13.9 percent to over one billion (table). Revenue passenger miles (RPMs) and available seat miles (ASMs) also increased, by 24.1% and 17.6 percent, to 1.49 and 1.79 trillion, respectively (first table). Therefore, load factor, the percentage of available seat miles flown by paying commercial passengers rose (from 78.72 to 83.06 percent). The table below shows passenger numbers for the five most recent fiscal years. The second table shows the economic impact of civil aviation during the first year of the pandemic, in terms of jobs, earnings, and overall impact in dollar and percentage terms. The impact fell from 4.9 percent in CY2019 to 2.3 percent in CY2020, the first year of the pandemic. (Estimates for more recent years are not yet available.)
Source: U.S. Dept. of Transportation, Bureau of Transportation Statistics, T100 Segment Data, April 5, 2024.
Passengers FY 2019¹; FY 2020²; FY 2021³; FY 2022⁴; FY 2023⁵. Yearly Passengers: 1,057,645, 399¹; 576,945,674²; 590,356,608³; 917,515,405⁴; 1,044,764,461⁵. Average Daily Passengers: 2,897,659¹; 1,576,354²; 1,617,415³; 2,513,741⁴; 2,862,368⁵, Revenue Passenger Miles(trillions): 1.57¹; 0.78²; 0.66³; 1.20⁴; 1.49⁵. Available Seat Miles (trillions): 1.88¹; 1.13²; 1.04³; 1.52⁴; 1.79⁵. Passenger Load Factor (%): 83.36%¹; 69.05%²; 63.84%³; 78.72%⁴; 83.06%⁵.
Economic Impact of Civil Aviation CY2019*¹ ; CY2020*² . Aviation in US generates # jobs: 10,393,000¹ ; 4,931,000² . Earnings of (billions) : $541.10¹ ; $259.10² . Aviation contributes annually (trillions): $1.92¹ ; $0.91². Constitutes % of GDP: 4.9%¹ ; 2.3%² . *Estimates for more recent years are not yet available.
Sources: Passenger Statistics: U.S. Dept. of Transportation, Bureau of Transpor -tation Statistics, T100 Segment Data, April 5, 2024. Economic Impact of Civil Aviation: Federal Aviation Administration, Office of Aviation Policy and Plans, Forecast and Performance Analysis Division (APO-100), Economic Impact of Civil Aviation on the U.S. Economy,August 2022. https://www.faa.gov/sites/faa.gov/files/2022-08/2022-APL-038%202022_economic%20impact_report.pdf FAA Air Traffic Organization • System Operations Services Page 6 Air Traffic By the Numbers
Instrument Flight Rule (IFR) and Visual Flight Rule (VFR)* Flights across the NAS By FAA Order, Air Traffic By the Numbers, published by the Office of Performance Analysis (AJR-G), is the official source of IFR flights counts.** During FY2023, the number of IFR flights was 15,712,724. AJR-G data show the number of IFR flights rose by 1.8 percent, and the number of VFR flights rose by 4.7 percent to 14.1 million. (During FY2019, prior to the COVID pandemic, IFR and VFR flights numbered 16.4 million and 12.9 million, respectively.) IFR vs VFR in Aviation | Understanding the Differences, click here. Here
*Note: Total VFR activity is approximated as airport arrival plus departure operations, divided by 2; plus VFR overflights. Editions of the ATO Fact Book prior to April 2023 did not include VFR overflights. **FAA Order JO 7200.24, “Authority to Define and Report Operational Metrics”; effective December 26, 2018. Total numbers of fiscal year annual IFR and VFR flights also appear in the table below.
Year; IFR Flights; VFR Flights. FY2005; 18,645,898; 14,489,723. FY2006; 18,066,360; 14,043,414. FY2007; 17,970,314; 14,121,870. FY2008; 17,908,487; 13,831,268. FY2009; 16,428,893; 13,314,949. FY2010; 16,522,406; 12,678,715. FY2011; 15,992,536; 12,433,620. FY2012; 15,760,241; 12,693,012. FY2013; 15,576,396; 12,504,343. FY2014; 15,546,452; 12,425,953. FY2015; 15,782,675; 12,265,462. FY2016; 15,724,478; 12,203,468. FY2017; 15,800,679; 12,104,334. FY2018; 16,122,488; 12,507,815. FY2019; 16,416,056; 12,887,828. FY2020; 12,270,055; 11,864,718. FY2021; 13,028,643; 12,882,339. FY2022; 15,436,595; 13,439,378. FY2023; 15,712,724 14,066,291.
Source: Federal Aviation Administration, Air Traffic Organization, Office of Performance Analysis (AJR-G), February 28, 2024 (for IFR), December 15, 2023 (for VFR).
FAA Air Traffic Organization • System Operations Services Page 7 Air Traffic By the Numbers
Section 2. Demand and Efficiency in the NAS
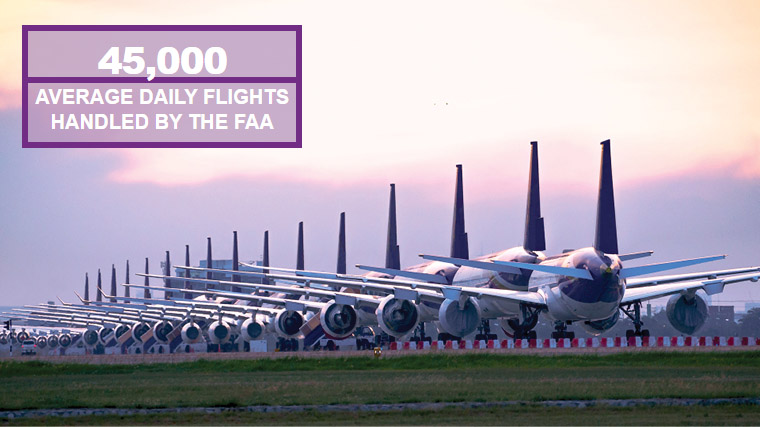
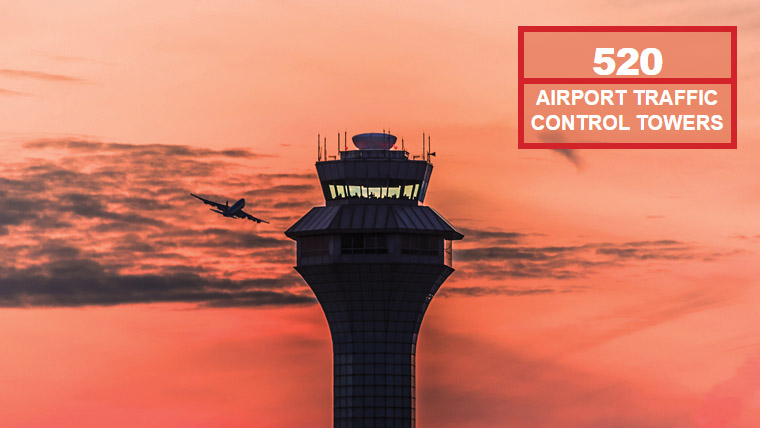
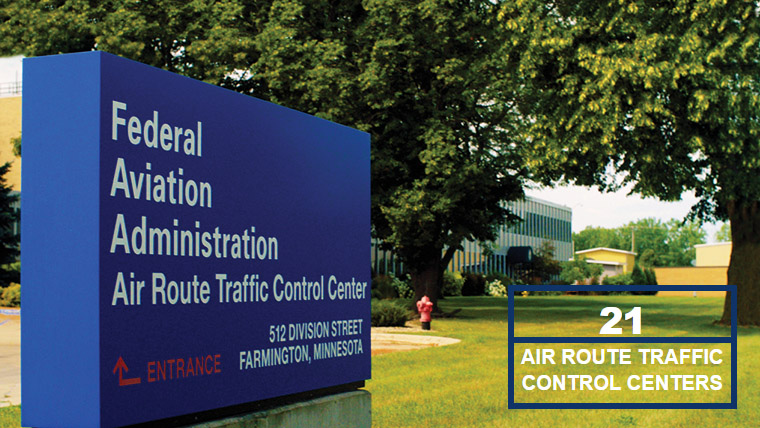
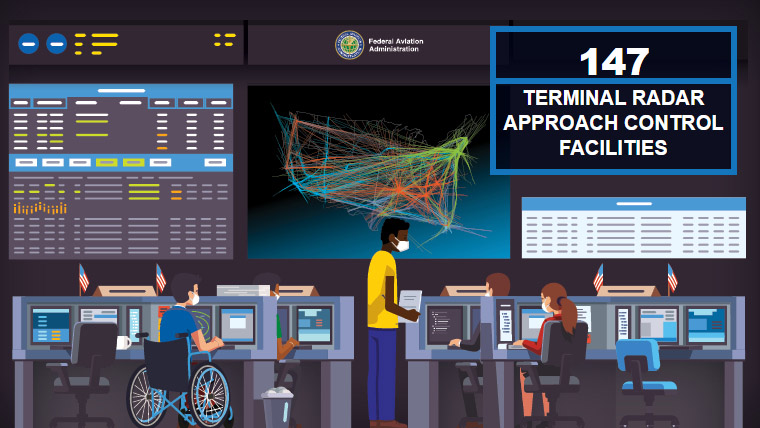
The NAS is composed of 521 airport towers (263 Federal and 262 contract towers), 146 terminal radar control (TRACON) facilities (25 stand-alone and 121 combined ATCT), and 25 control centers (21 air route traffic control centers (ARTCC) and 4 combined control facilities (CCF). TRACONs handle descending flights received from a center or ascending flights received from an ATC tower. Of the 146 TRACONs in the NAS, 121 of them are combined such that the TRACON exists in the same location as the ATC tower. Such facilities include the Miami, Charlotte, and El Paso towers. Centers handle all en route flights operating on Instrument Flight Rule (IFR) flight plans. Centers receive flights from or hand off flights to other centers throughout the flight’s en route phase of operation. They also receive flights or hand off flights to TRACONs when flights enter or exit the en route phase of operation. This report reveals the demand observed at some of the busiest facilities, represented by the Core 30 airport towers, the 25 stand -alone TRACONs, and all 25 centers (which include 4 CCFs). Efficiency is also reported based on the following metrics: Number of Flights at Any Given Minute Average Hourly Capacity Average Daily Capacity
FAA Air Traffic Organization • System Operations Services page 8 Air Traffic By the Numbers
Core 30 Airport Operations Airport operations are the sum of the number of airport arrivals and departures. Airport traffic controllers handle such operations. Each flight has a departure and arrival, meaning each flight roughly consists of two airport operations. In FY2023, Core 30 airport operation numbers rose by 3.8 percent, from 11.8 million in FY2022 to 12.2 million (table below). During the three years before the pandemic (FY2017-FY2019), Core 30 airport operations averaged 13 million; therefore, operations remain below this pre-pandemic level. (Among all airports operating FAA towers, operations rose by 3.2 percent, to 37.3 million. Among all 523 Federal towers (including 260 contract towers), operations rose by 3.7 percent, to 54.5 million.) Also shown below are airport operations for each Core 30 airport. In FY2023, Atlanta (ATL), Chicago O’Hare (ORD), and Dallas Fort Worth (DFW) had the highest number of operations; operations rose at ATL and DFW by 5.3 and 1.9 percent but fell at ORD by 1.4 percent. Operations returned to pre-pandemic levels at ten airports (DFW, Denver (DEN), Las Vegas (LAS), JFK, Miami (MIA), Phoenix (PHX), Orlando (MCO), Honolulu (HNL), Washington National (DCA), and Tampa (TPA).) (See, Appendix I for explanations of the Core 30 airport codes.)
Total Core 30 Airport Operations FY17-19Avg FY22 FY23 %Change 13,014,040 11,758,471 12,206,459 3.8%Airport ATL BOS BWI CLT DCA DEN DFW DTW EWR FLL HNL IAD IAH JFK LAS Rank* 1 15 26 7 21 4 3 24 11 22 18 25 13 8 5 FY17-19Avg 892,531 418,820 262,185 556,837 297,834 602,692 674,069 394,476 446,791 322,202 314,595 301,318 462,986 458,526 543,391 FY22 724,226 371,622 218,649 506,290 286,580 613,679 663,426 292,174 403,583 285,994 311,135 279,429 409,248 433,538 570,513 FY23 762,526 399,843 231,933 518,205 301,002 647,440 675,807 285,448 433,363 297,197 324,429 281,198 415,518 479,050 603,015 Airport LAX LGA MCO MDW MEM MIA MSP ORD PHL PHX SAN SEA SFO SLC TPA Rank* 6 17 14 27 30 9 20 2 23 10 29 12 16 19 28 FY17-19Avg 701,467 369,527 348,469 243,601 225,764 414,830 410,011 889,128 378,600 433,000 218,941 431,030 462,422 334,366 203,632 FY22 564,083 342,587 358,854 208,805 216,521 459,270 315,152 727,018 288,474 419,532 201,184 397,095 346,585 328,920 214,305 FY23 565,995 364,561 402,248 229,425 212,023 455,361 316,496 716,920 291,642 442,858 218,538 416,651 376,900 317,158 223,709 *Ranked by FY23 operations. Source: Federal Aviation Administration, Air Traffic Organization, Office of Performance Analysis (AJR-G), Operations Network (OPSNET), November 17, 2023. FAA Air Traffic Organization • System Operations Services 9 Air Traffic By the Numbers Stand‐Alone Terminal Radar Control (TRACON) FacilitiesTRACON operations are IFR and VFR itinerant operations passed to and from area airports, other TRACONs, or centers, including overflights through TRACON airspace. In FY2023, among the 25 stand-alone TRACONs, operations rose by 1.8 percent to 19.2 million. Before the pandemic (FY2017-FY2019), stand-alone operations averaged 19.9 million, meaning operations remain below pre-pandemic levels (table below). Among the 124 combined TRACONs, operations numbered 18.7 million in FY2023 (not shown below). Across all 146 TRACONs (stand-alone, plus combined), operations rose by 0.8 percent, from 37.7 to 38.0 million in FY2023. Before the pandemic, operations averaged 38.5 million (not shown below). Below are operation counts for each of the 25 stand-alone TRACONs for the pandemic years FY2022 and FY2023 and the prepandemic annual average (FY2017-FY2019). In FY2023, Southern California (SCT) New York (N90), and Northern California (NCT) had the highest number of operations with more than 1.4 million each. At 11 of the 25 TRACONs, operations recovered to FY2017-FY2019 pre-pandemic levels (graph and table below). (See, Appendix I for explanations of the TRACON facility codes.)
Total Stand-Alone TRACON Operations FY17-19 Avg FY22 FY23 %Change19,940,704 18,892,526 1.8%19,240,916 TRACON Rank* A11 19 A80 7 A90 10 C90 6 D01 8 D10 5 D21 16 F11 11 I90 9 L30 13 M03 20 M98 17 N90 2 FY17-19 Avg 275,585 1,213,101 750,414 1,277,423 885,750 1,247,768 530,295 730,043 951,472 602,603 301,072 526,313 1,953,783 FY22 302,421 1,067,921 771,789 1,091,896 900,930 1,295,129 449,916 677,008 904,424 646,219 298,687 436,649 1,838,109 FY23 308,176 1,093,853 777,434 1,098,161 936,779 1,311,316 436,755 765,784 902,679 679,238 294,867 434,505 1,903,319 TRACON Rank* 3 NCT 22 P31 12 P50 21 P80 PCT 4 R90 23 S46 14 S56 15 SCT 1 18 T75 24 U90 Y90 25 FY17-19 Avg 1,674,540 300,023 708,956 329,709 1,400,750 209,962 615,142 457,064 2,230,827 316,870 193,273 201,964 FY22 1,489,120 274,095 683,380 273,620 1,343,486 223,383 594,336 474,131 2,173,998 289,442 202,936 189,501 FY23 1,492,119 275,554 695,344 285,697 1,370,604 220,698 618,816 472,467 2,119,849 358,540 203,960 184,402 *Ranked by FY2023 operations.
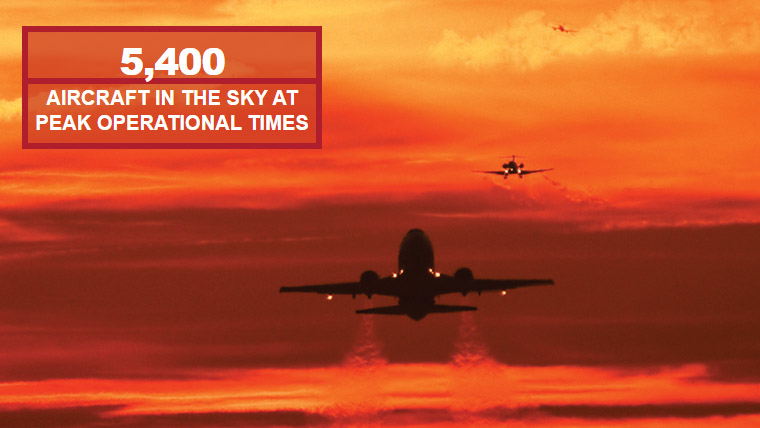
Source: Federal Aviation Administration, Air Traffic Organization, Office of Performance Analysis (AJR-G), Operations Network (OPSNET), November 20, 2023. FAA Air Traffic Organization • System Operations Services 10 Air Traffic By the Numbers Air Route Traffic Control Centers (ARTCC) and Combined Control Facilities (CCF)Air route traffic control centers (ARTCC) or en route operations are the number of IFR and VFR itinerant operations passing from a TRACON to a center, or from one center to another center, or from a center to a TRACON. It includes U.S. overflights and oceanic traffic through center air space that do not arrive at or depart from U.S. territory. In FY2023, en route operationnumbers for the 21 ARTCC and 4 CCFs (combined control facilities) rose by 2.1 percent, from 41.4 to 42.3 million; however, operations have yet to recover to the FY2017-FY2019 pre-pandemic average levels of 44.1 million (table below). Also shown below are operation counts for FY2022 and FY2023 and the pre-pandemic averages for FY2017-FY2019 by center. In FY2023, the Atlanta (ZTL), Miami (ZMA), and Jacksonville (ZJX) centers reported the highest number of operations among the centers, each with more than 2.4 million. Center operations for Miami, Jacksonville, Los Angeles (ZLA), Denver (ZDV), Albuquerque (ZAB), Salt Lake City (ZLC), Honolulu (HCF), have recovered to pre-pandemic levels (graph and table below). (See, Appendix I for explanations of the ARTCC and CCF codes.)Total ARTCC & CCF Operations FY17-19 Avg FY22 FY23 %Change 44,147,204 41,436,609 42,312,939 2.1% Center HCF JCF ZAB ZAN ZAU ZBW ZDC ZDV ZFW ZHU ZID ZJX ZKC Rank* 22 24 16 21 10 19 5 13 8 7 12 3 15 FY17-19 Avg 466,374 87,067 1,609,158 611,191 2,421,304 1,574,246 2,509,288 1,874,490 2,301,123 2,271,141 2,092,253 2,452,192 1,800,362 FY22 459,957 218,089 1,665,476 571,677 2,054,628 1,369,330 2,285,412 1,878,702 2,207,777 2,228,825 1,967,633 2,492,247 1,739,180 FY23 476,934 188,922 1,710,409 570,946 2,053,984 1,484,095 2,351,499 1,934,737 2,231,636 2,243,556 2,002,184 2,494,032 1,759,811 Center ZLA ZLC ZMA ZME ZMP ZNY ZOA ZOB ZSE ZSU ZTL ZUA Rank* 6 18 2 9 14 4 17 11 20 23 1 25 FY17-19 Avg 2,282,499 1,471,415 2,424,266 2,162,893 1,983,224 2,637,886 1,802,700 2,389,671 1,246,442 315,178 3,092,693 268,149 FY22 2,247,809 1,454,448 2,440,120 2,135,332 1,759,386 2,266,267 1,613,370 1,955,286 1,128,896 290,086 2,878,068 128,608 FY23 2,313,101 1,492,549 2,499,387 2,151,988 1,770,122 2,382,714 1,672,262 2,008,714 1,137,088 290,882 2,908,171 183,216 *Ranked by FY2023 operations. Source: Federal Aviation Administration, Air Traffic Organization, Office of Performance Analysis (AJR-G), Operations Network (OPSNET), November 21, 2023. FAA Air Traffic Organization • System Operations Services 11 Air Traffic By the Numbers Number of IFR Flights at Any Given Minute during Peak Operational Times5,000 Flights Traffic flow management system (TFMS) flight data were used to determine the number of flights en route every minute of the day and by U.S. time zone on July 20, 2023. Peak operational times in the NAS range between 1500 GMT and 2200 GMT. During peak operational times in the NAS on that day, there were over 5,400 IFR flights en route in the NAS every minute. The figure below shows the average number of flights en route per minute and flights under air traffic control by time zone. The Eastern Time zone has the largest share of flights in the NAS on average and, in this analysis, also includes flights under air traffic control from Puerto Rico and Bermuda. The Pacific Time Zone category includes all west coast air traffic as well as oceanic operations controlled by Oakland center (ZOA), including Hawaii and Guam. Source: Federal Aviation Administration, Air Traffic Organization, Office of Performance Analysis (AJR-G), April 9, 2024. FAA Air Traffic Organization • System Operations Services 12 Air Traffic By the Numbers Average Hourly Capacity (Called Rate) at Core 30 AirportsIn general, airport capacity is determined by its runways and surrounding airspace. For this report, capacity is represented byan airport’s called rates for reportable hours. In FY2023, average hourly capacity across all Core 30 airports was 3,612. Note,airport capacity is not determined by circumstances such as the pandemic. Prior to the pandemic capacity averaged 3,643 operations per hour (table below). In FY2023, the highest average hourly called rates were at Atlanta (ATL) and Chicago O’Hare (ORD). Each had an average called rate of over 200 operations per hour. The largest increases occurred at Salt Lake City (SLC) (up 2.8 percent) and Washington Dulles (IAD) (up 2 percent). The largest decrease occurred at Honolulu (HNL) (down 23.6 percent) due to runway construction. (See, Appendix I for explanations of the Core 30 airport codes.)AHC Across All Core 30 Airports FY17-19 Avg FY22 FY23 %Change3,691 3,725 3,661 -1.7%Airport ATL Rank*1 BOS 23 BWI 28 CLT 7 DCA 29 DEN 4 DFW 3 DTW 5 EWR 25 FLL 18 HNL 24 IAD 13 IAH 6 JFK 20 LAS 19 FY17-19 Avg 229 86 69 151 67 208 188 156 79 97 112 134 158 88 103 FY22 230 84 69 152 FY232288668150 Airport LAX LGA MCO MDW Rank*12 26 10 27 66 67 MEM 8 195 192 MIA 15 209 165 79 20516178 MSP ORD PHL 9 2 17 103 112 131 165 91 102 100851341599395 PHX SAN SEA SFO SLC TPA 14 30 22 21 11 16 FY17-19 Avg 132 73 150 69 148 128 144 211 101 129 48 88 93 133 119 FY22 FY23138 13574 75143 13971 71152 149130 128142 143213 210102 104130 12948 4890 9093 91133 137113 112*Ranked by FY2023 call rates. Source: Federal Aviation Administration, Air Traffic Organization, Office of Performance Analysis (AJR-G), Aviation System Performance Metrics (ASPM), November 22, 2023.FAA Air Traffic Organization • System Operations Services 13 Air Traffic By the Numbers Average Daily Capacity (ADC) ‐ Based on Called Rates at Core 30 AirportsIn general, airport capacity is determined by its runways and surrounding airspace. For the purposes of this report, capacity is represented by the airport’s called rates for reportable hours. Average daily capacity (ADC) is the ATO’s official tracking method for determining an airport’s capacity during a day. In FY2023, capacity across all Core 30 airports was 60,431 (table below). Airport capacity is not determined by circumstances such as the pandemic. In FY2023, data for the Core 30 airports show that the highest ADCs were found at Atlanta (ATL), Chicago (ORD), Dallas-Fort Worth (DFW), Memphis (MEM), and Denver (DEN); each with an average of over 3,000 operations per day. Note, ADC is high for Memphis (MEM) because all 24 hours are reportable there. A large decrease occurred at Honolulu (HNL) (due to runway construction). (See, Appendix I for explanations of the Core 30 airport codes.) ADC Across All Core 30 Airports FY17-19 Avg FY22 FY23 %Change 60,931 61,511 60,431 -1.8% Airport ATL BOS BWI CLT DCA DEN DFW DTW EWR FLL HNL IAD IAH JFK LAS Rank*1 23 27 8 29 5 3 6 25 17 24 14 9 18 20 FY17-19 Avg 3,664 1,460 1,171 2,414 1,068 3,335 3,009 2,500 1,349 1,655 1,898 2,147 2,375 1,580 1,752 FY22 3,684 1,434 1,165 2,425 1,058 3,117 3,343 2,635 1,335 1,757 1,900 2,102 2,478 1,635 1,728 FY233,6421,4581,1612,3951,0743,0653,2752,5811,3331,7031,4512,1442,3841,6661,616 Airport LAX LGA MCO MDW MEM MIA MSP ORD PHL PHX SAN SEA SFO SLC TPA Rank*7 26 11 28 4 13 10 2 19 15 30 22 21 12 16 FY17-19 Avg 2,379 1,166 2,395 1,111 3,098 2,180 2,302 3,376 1,610 2,057 762 1,498 1,585 2,123 1,910 FY22 2,486 1,187 2,293 1,128 3,194 2,205 2,279 3,403 1,637 2,082 763 1,530 1,587 2,130 1,811 FY232,4261,1972,2181,1373,1252,1802,2863,3581,6622,0667731,5291,5402,1891,797*Ranked by FY2023 daily capacity. Source: Federal Aviation Administration, Air Traffic Organization, Office of Performance Analysis (AJR-G), Aviation System Performance Metrics (ASPM), November 22, 2023. FAA Air Traffic Organization • System Operations Services 14
Air Traffic By the Numbers
Section 3. NAS Delay, Diversions, Go‐Arounds, and Cancellations
Only flights departing from or arriving at their destination at least 15 minutes late are counted as a NAS system delay. The charts that appear below are based on OPSNET numbers, ATO’s official source for delay data. Many factors contribute to delay, with weather is the most frequently cited reason. Delay imposes stress on the NAS, air traffic controllers, passengers, and the economy.
Diversions occur when a flight is rerouted to a different airport than its original destination. This usually occurs due to convective weather. Other less frequent reasons for diversions are medical emergencies, security, issues with the aircraft, or issues with passengers or crewmembers.
Go-Arounds occur when an aircraft is on approach to the runway but suddenly aborts the landing. This occurs if there is a sudden shift in the wind, an obstruction on the runway, or possibly, the aircraft inadvertently overshooting the runway. Go-arounds result in the aircraft returning to the landing queue to attempt another landing.
Cancellations can occur for numerous reasons due to weather, extensive delays in the system, air carrier crew or equipment issues, etc. Such reasons may not necessarily be under FAA’s control. Air carriers cancel their own flights in response to these issues. Since the three-hour tarmac rule was imposed after 2010, more flights have been cancelled. This increase in cancellations means reductions in the number of recorded delays. During FY2020, the sudden decrease in the demand for air transportation due to the COVID-19 pandemic led to flight cancellations by airlines.
Cancellations can occur for numerous reasons due to weather, extensive delays in the system, equipment issues, etc. Air carriers cancel their own flights in response to these issues. Since the three-hour tarmac rule was imposed after 2010, more flights have been cancelled. This increase in cancellations means reductions in the number of recorded delays. During FY2020, the sudden decrease in the demand for air transportation due to the COVID-19 pandemic led to flight cancellations by airlines. FAA Air Traffic Organization • System Operations Services 15 Air Traffic By the Numbers Counts of NAS Delay at Core 30 AirportsDuring FY2023, OPSNET data show that the number of Core 30 airport departure delays of at least 15 minutes rose significantly, by 50.6 percent to 153,312 (table below). Since FY2017-FY2019, before the pandemic began, Core 30 airport departure delays fell by 45.6 percent from 281,899. The graph and table below show, in FY2023, delays were highest at Las Vegas (LAS), LaGuardia (LGA), and Newark (EWR), each with 13,000 or more delays. Together these three airports accounted for about 40 percent of all Core 30 airport delays. All but eight airports show decreases in delays since before the pandemic (LAS, Denver (DEN), Miami (MIA), San Diego (SAN), Orlando (MCO), Honolulu (HNL), Tampa (TPA), and Chicago Midway (MDW)). (See, Appendix I for explanations of the Core 30 airport codes.) Core 30 Total Delay Counts FY17-19 Avg FY22 FY23 %Change 281,899 101,787 153,312 50.6% Airport ATL Rank* 16 BOS 7 BWI 26 CLT 13 DCA 11 DEN 5 DFW 10 DTW 28 EWR 3 FLL 19 HNL 22 IAD 23 IAH 12 JFK 6 LAS 1 FY17-19 Avg 6,645 13,473 585 5,118 5,422 4,178 10,245 1,539 44,129 1,943 38 1,127 4,774 17,849 5,683 FY22 1,803 3,911 286 2,434 4,130 5,391 4,530 236 13,832 777 6 747 2,062 4,133 14,660 FY23 2,286 8,290 484 3,156 4,503 9,570 5,204 383 13,729 1,849 904 600 3,210 8,692 29,763 Airport LAX LGA MCO MDW MEM MIA MSP ORD PHL PHX SAN SEA SFO SLC TPA Rank* 17 2 21 25 27 9 29 8 20 15 18 14 4 30 24 FY17-19 Avg 21,631 40,819 425 449 812 2,579 2,316 24,115 11,946 6,387 934 13,432 32,947 278 80 FY22 2,412 14,028 998 192 237 5,058 409 8,918 1,478 1,038 1,245 1,844 3,794 231 967 FY23 2,263 20,019 1,670 542 474 5,997 268 7,350 1,815 2,295 1,897 2,995 12,303 231 570 *Ranked by number of FY2023 delays. Source: Federal Aviation Administration, Air Traffic Organization, Office of Performance Analysis (AJR-G), Operations Network (OPSNET), November 24, 2023.FAA Air Traffic Organization • System Operations Services 16 Air Traffic By the Numbers Delays by Category The two charts below show the sources of delays at Core 30 airports by type of delay. Note: System impact delays are delays assigned to causal facilities in OPSNET and are composed of delays due to TMIs, departure delays, and airborne delays. System impact delays are also the basis for delays by class and delays by cause in OPSNET. (http://aspmhelp.faa.gov/index.php/OPSNET_Reports:_Definitions_of_Variables) Source: Federal Aviation Administration, Air Traffic Organization, Office of Performance Analysis (AJR-G), Operations Network (OPSNET), December 18, 2023. FAA Air Traffic Organization • System Operations Services 17 Air Traffic By the Numbers Diversions at Core 30 AirportsThe airports reported below are the original intended destinations for the diverted aircraft. Increases in the number of diversions can indicate capacity issues at the airport due to weather, construction, or volume. Over all Core 30 airports, the number of diversions rose by 13.5 percent in FY2023; however, since before the start of the pandemic, Core 30 airport diversions fell by 18.7 percent from 17,779 (table below). Airports with the highest increases in diversions were Orlando (MCO) (with 57.8 percent), Fort Lauderdale (FLL) (48.2 percent), and Atlanta (ATL) (36.5 percent). Airports with the highest decreases were Memphis (MEM) (-12.4 percent), Honolulu (HNL) (-12.2 percent), and Seattle-Tacoma (SEA) (-11.8 percent). (See, Appendix I for explanations of the Core 30 airport codes.) Core 30 Total Diversions FY17-19 Avg FY22 FY23 %Change 17,779 12,737 14,451 13.5% Airport ATL BOS BWI CLT DCA DEN DFW DTW EWR FLL HNL IAD IAH JFK LAS Rank* 10 13 26 12 16 2 1 29 8 3 30 21 11 13 9 FY17-19 Avg 1,025 454 331 778 507 902 1,404 344 874 562 85 415 819 618 488 FY22 419 437 222 481 365 679 881 138 727 570 131 368 460 369 524 FY23 572 492 273 508 415 895 904 170 647 845 115 327 566 492 646 Airport LAX LGA MCO MDW MEM MIA MSP ORD PHL PHX SAN SEA SFO SLC TPA Rank* 15 5 7 18 20 4 28 6 25 17 27 24 23 22 19 FY17-19 Avg 445 876 552 574 603 628 493 1,359 439 492 311 369 336 374 325 FY22 426 661 443 343 410 595 228 729 248 447 200 314 221 298 403 FY23 467 735 699 398 359 771 216 717 274 400 269 277 295 324 383 *Ranked by number of FY2023 diversions. Source: Federal Aviation Administration, Air Traffic Organization, Office of Performance Analysis (AJR-G), Aviation System Performance Metrics (ASPM), December 28, 2023. FAA Air Traffic Organization • System Operations Services 18 Air Traffic By the Numbers Go‐Arounds at Core 30 AirportsGo-arounds as a percent of arrival operations at each Core 30 airport (except Honolulu) appear below. In FY2023, average go-arounds as a percent of arrivals across all Core 30 airports rose by 7.4 percent to about 0.39 percentage point of arrivals (tables and graph below). This occurred mainly due to a large increase in go-arounds relative to a smaller increase in arrival operations. (The estimates presented here are based on ASPM and CountOps data.) (See, Appendix I for explanations of the Core 30 airport codes.) Core 30 Go Arounds As Percent of Arrivals FY17-19 Avg FY22 FY23 %Change 0.3% 0.36% 0.39% 7.4% AirportATL BOS BWI CLT DCA DEN DFW DTW EWR FLL IAD IAH JFK LAS LAX FY17-19 Avg 0.2% 0.3% 0.4% 0.3% 0.6% 0.5% 0.3% 0.4% 0.3% 0.3% 0.2% 0.2% 0.3% 0.3% 0.3% FY22 0.3% 0.2% 0.5% 0.4% 0.8% 0.6% 0.3% 0.3% 0.3% 0.3% 0.3% 0.2% 0.3% 0.3% 0.2% FY230.3% 0.3% 0.4% 0.4% 0.8% 0.5% 0.3% 0.4% 0.3% 0.4% 0.3% 0.3% 0.3% 0.5% 0.2% Airport LGA MCO MDW MEM MIA MSP ORD PHL PHX SAN SEA SFO SLC TPA FY17-19 Avg 0.5% 0.3% 0.4% 0.4% 0.4% 0.3% 0.3% 0.5% 0.2% 0.5% 0.2% 0.4% 0.4% 0.2% FY22 0.5% 0.5% 0.5% 0.4% 0.4% 0.3% 0.4% 0.5% 0.3% 0.3% 0.3% 0.4% 0.4% 0.3% FY23 0.5% 0.4% 0.4% 0.3% 0.5% 0.3% 0.4% 0.5% 0.3% 0.5% 0.3% 0.5% 0.3% 0.3% * Excludes Honolulu (HNL). Sources: Go-arounds: Federal Aviation Administration, Air Traffic Organization, Office of Performance Analysis (AJR-G), Aviation System Performance Metrics (ASPM), December 29, 2023; Arrivals: Federal Aviation Administration, Air Traffic Organization, Office of Performance Analysis (AJR-G), CountOps, December 29, 2023. FAA Air Traffic Organization • System Operations Services 19 Air Traffic By the Numbers Cancellations at Core 30 AirportsDuring FY2023, flight departure cancellations at Core 30 airports decreased by 27.2 percent, to 93,179 (table below). Cancellations may be due to weather, system delays, equipment issues, or other reasons, such as the COVID pandemic. The airports with the highest number of cancellations were the hubs of Denver (DEN), Chicago O’Hare (ORD), LaGuardia (LGA), Newark (EWR), and Dallas-Fort Worth (DFW), each with over 6,000 (table and graph below). Together, cancellations at these airports account for over 25 percent of all cancellations. (See, Appendix I for explanations of the Core 30 airport codes.) Core 30 Total Cancellations FY17-19 Avg FY22 FY23 %Change 104,156 127,963 93,179 -27.2% Airport ATL BOS BWI CLT DCA DEN DFW DTW EWR FLL HNL IAD IAH JFK LAS Rank* 6 10 24 13 11 1 4 19 3 16 30 27 12 7 9 FY17-19 Avg 4,153 4,667 2,674 5,597 4,160 3,551 6,856 2,294 6,578 2,144 384 1,927 3,863 4,134 1,771 FY22 5,040 5,033 2,769 6,009 6,032 6,509 9,742 2,892 8,944 2,695 624 2,708 3,615 5,568 3,294 FY23 4,138 3,440 1,962 2,616 3,180 6,837 6,043 2,290 6,440 2,492 865 1,562 2,689 4,125 3,515 Airport LAX LGA MCO MDW MEM MIA MSP ORD PHL PHX SAN SEA SFO SLC TPA Rank* 14 2 8 20 28 23 17 5 21 18 26 15 22 29 25 FY17-19 Avg 3,058 7,473 2,666 2,293 1,891 2,667 1,873 11,030 5,501 1,952 1,228 2,315 3,586 659 1,207 FY22 3,737 8,930 4,596 1,797 3,951 4,261 2,291 9,320 3,249 3,105 1,277 3,703 2,298 1,517 2,457 FY23 2,567 6,672 3,932 2,246 1,476 2,090 2,371 5,669 2,180 2,300 1,711 2,513 2,122 1,323 1,813 Source: Federal Aviation Administration, Air Traffic Organization, Office of Performance Analysis (AJR-G), Aviation System Performance Metrics (ASPM), January 3, 2024. FAA Air Traffic Organization • System Operations Services 20 Air Traffic By the Numbers Section 4. Traffic Management InitiativesTraffic Management Initiatives (TMIs) are programs and tools that ATC may use to manage air traffic. These initiatives can take a number of forms, depending on the need and situation. Some TMIs are used to manage excess demand or a lowered acceptance rate at a particular airport. Other TMIs are used to manage traffic issues in the en route environment usually caused by convective weather. The TMIs reported in this report include: Ground Delay Programs (GDP) Ground stops (GS) Airspace Flow Programs (AFP) Holdings FAA Air Traffic Organization • System Operations Services 21 Air Traffic By the Numbers Ground Delay Programs at Core 30 AirportsA ground delay program (GDP) is a TMI where aircraft are delayed at their departure airport to reconcile demand with capacity at their arrival airport. GDPs are airport-specific; therefore, each GDP is reported for a particular airport. During FY2023, GDPs increased by 51.8 percent across all Core 30 airports, from 475 to 721. Before the pandemic (FY2017-2019), the average number of GDPs was 1,190 (table below). In FY2023, San Francisco (SFO), Newark (EWR), and LaGuardia (LGA) had the highest number of GDPs. Together, these three airports accounted for over 39 percent of all GDPs at Core 30 airports. Since before the pandemic (FY2017-2019), GDPs rose at nine Core 30 airports (LAS, DEN, FLL, CLT, MIA, MCO, MDW, TPA, and SLC (graph and table below)). (See, Appendix I for explanations of the Core 30 airport codes.) Total Core 30 GDPs FY17-19 Avg FY22 FY23 %Change 1,190 475 721 51.8% Airport ATL BOS BWI CLT DCA DEN DFW DTW EWR FLL HNL IAD IAH JFK LAS FY17-19 Avg 17 84 6 7 21 19 29 5 214 4 0 7 18 97 16 FY22 2 31 3 7 23 33 21 0 101 1 0 4 8 27 44 FY23 10 66 1 9 17 64 15 5 97 12 0 3 13 55 75 Airport LAX LGA MCO MDW MEM MIA MSP ORD PHL PHX SAN SEA SFO SLC TPA FY17-19 Avg 57 126 1 2 10 1 10 66 68 42 2 71 190 0 0 FY22 1 70 4 0 1 7 5 34 10 2 3 13 16 2 2 FY23 1 82 4 3 2 9 4 20 26 9 2 12 103 1 1 Source: Federal Aviation Administration, Air Traffic Organization, Office of Performance Analysis (AJR-G), Operations Network (OPSNET), April 1, 2024.FAA Air Traffic Organization • System Operations Services 22 Air Traffic By the Numbers Ground Stops at Core 30 AirportsGround stops are the most restrictive form of TMI because they hold all aircraft, within the scope of the ground stop, at theirdeparture airports until conditions at the destination airport allow for their arrival. Ground stops only affect arrivals to a specific airport (not departures) and, like GDPs, are airport specific. During FY2023, the number of ground stops increased by 19.6 percent across all Core 30 airports, from 1,388 to 1,660. Before the pandemic (FY2017-2019), the average number of ground stops was 1,716 (table below). During FY2023, LaGuardia (LGA), Newark (EWR), and Denver (DEN) had the highest number of ground stops (graph and table below). (See, Appendix I for explanations of the Core 30 airport codes.) Since before the pandemic (FY2017-2019), ground stops rose at eighteen Core-30 airports. Total Core 30 Ground Stops FY17-19 Avg FY22 FY23 %Change 1,716 1,388 1,660 19.6% Airport ATL BOS BWI CLT DCA DEN DFW DTW EWR FLL HNL IAD IAH JFK LAS FY17-19 Avg 66 47 28 53 55 76 70 26 152 11 0 33 52 66 28 FY22 54 41 37 68 76 73 62 9 180 23 0 39 30 69 58 FY23 50 82 38 47 88 118 74 19 170 49 0 34 54 82 90 Airport LAX LGA MCO MDW MEM MIA MSP ORD PHL PHX SAN SEA SFO SLC TPA FY17-19 Avg 13 170 24 24 19 13 26 109 121 14 8 43 78 7 9 FY22 12 163 67 23 11 41 15 85 50 19 10 20 19 3 31 FY23 8 206 83 21 17 78 12 67 47 20 9 17 46 9 25 Source: Federal Aviation Administration, Air Traffic Organization, Office of Performance Analysis (AJR-G), Operations Network (OPSNET), April 1, 2024. FAA Air Traffic Organization • System Operations Services 23 Air Traffic By the Numbers Airspace Flow Programs by CenterImagine a line drawn in space in association with a constraint, usually convective weather. Under an airspace flow program, any flights filed that crosses the line (usually only in one direction) are assigned an expected departure clearance time (EDCT) by air traffic managers through the flow constrained area, to ensure that it arrives at the line, or “boundary,” at a time when it can be accommodated. In FY2023, there were 177 airspace flow programs (AFP) imposed by air traffic managers versus 175 in FY2022, an increase of 1.1 percent. The main reasons for the 177 AFPs in FY2023 were weather conditions and traffic volume. Before the pandemic (FY2017-2019), the average number of AFPs was 140 (table below).In FY2023, AFPs mainly affected Jacksonville (ZJX) and Miami (ZMA). Together, these centers accounted for 128 of the 177 AFPs. Since before the pandemic (FY2017-2019), the largest increase in AFPs occurred at Jacksonville (ZJX) (graph and table below). (These estimates are based on National Traffic Management Log (NTML) data.) (See, Appendix I for explanations of the ARTCC and CCF codes.) * Data for CCF JCF are not available. Total Centers Air Flow Programs FY17-19 Avg FY22 FY23 %Change 140 177 175 1.1% Center HCF ZAB ZAN ZAU ZBW ZDC ZDV ZFW ZHU ZID ZJX ZKC FY17-19 Avg 0 1 0 0 0 27 3 0 27 5 19 0 FY22 0 0 0 0 0 14 5 0 5 6 94 0 FY23 0 0 0 1 1 9 8 1 15 1 67 1 Center ZLA ZLC ZMA ZME ZMP ZNY ZOA ZOB ZSE ZSU ZTL ZUA FY17-19 Avg 8 0 24 0 0 2 0 22 0 0 0 0 FY22 0 0 40 0 0 1 3 7 0 0 0 0 FY23 0 0 61 1 2 5 0 4 0 0 0 0 Source: Federal Aviation Administration, Air Traffic Organization, Technical Operations (AJW), National Traffic Management Log(NTML), May 13, 2024. FAA Air Traffic Organization • System Operations Services 24 Air Traffic By the Numbers Holdings by CenterA holding occurs when an aircraft is deliberately delayed en route by flying in a repeating rotational pattern. They are typically implemented when there is traffic congestion or convective weather at the destination airport or an adjacent facility. During FY2023, there were 31,429 holdings, rising 26.7 percent from FY2022. Before the pandemic (FY2017-2019), the average number of holdings was far higher at 37,166 (table below). During FY2023, OPSNET data shows among Air Route Traffic Control Centers (ARTCC), the highest numbers of airborne holdings occurred in Miami (ZMA), DC (ZDC), Denver (ZDV), Jacksonville (ZJX), and Fort Worth (ZFW) (graph and table below). Holdings among these five centers accounted for over one-half of all holdings. (See, Appendix I for explanations of the ARTCC and combined control facility (CCF) codes.) * Data for CCF JCF are not available. Total Center Flight Holdings FY17-19 Avg FY22 FY23 %Change 37,166 24,813 31,429 26.7% Center ZAB ZAN ZAU ZBW ZDC ZDV ZFW ZHU ZID ZJX ZKC ZLA FY17-19 Avg 611 146 2,270 2,093 5,894 2,427 2,129 1,552 846 1,738 553 945 FY22 404 0 1,188 939 4,855 1,899 1,634 1,008 611 1,894 325 811 FY23 472 159 1,332 1,256 4,831 2,757 2,266 1,258 863 2,457 323 1,130 Center ZLC ZMA ZME ZMP ZNY ZOA ZOB ZSE ZTL ZSU HCF ZUA FY17-19 Avg 789 2,492 619 1,122 3,330 912 2,409 482 3,748 26 36 0 FY22 480 2,761 424 173 1,453 253 1,503 297 1,901 0 0 0 FY23 604 4,858 545 280 1,448 469 1,919 160 1,813 176 53 0 Source: Federal Aviation Administration, Air Traffic Organization, Office of Performance Analysis (AJR-G), Operations Network (OPSNET), January 8, 2024. FAA Air Traffic Organization • System Operations Services 25 Air Traffic By the Numbers Section 5. Safety MetricsThe U.S. national airspace system is the safest air transportation system in the world. This report presents metrics used to measure the safety of the NAS: Runway Incursions Incursions by Type Loss of Standard Separation Count FAA Air Traffic Organization • System Operations Services 26 Air Traffic By the Numbers Runway Incursions at Core 30 AirportsA runway incursion is any occurrence involving the incorrect presence of an aircraft, vehicle, or person on the protected area of a surface designated for the landing and takeoff of aircraft. Across all Core 30 airports, the number of runway incursions rose from 299 in FY2022 to 362 in FY2023. Before the pandemic (FY2017-2019), the average annual number of runway incursions was higher, at 391 (table below). In FY2023, the highest numbers of runway incursions occurred at Chicago Midway (MDW) and Honolulu (HNL). The number of runway incursions exceeded pre-pandemic levels at ten airports, most notably at Chicago Midway (MDW) (graph and table below). Incursions by airport and by type appear on the next page. (See, Appendix I for explanations of the Core 30 airport codes.)Core 30 Total Runway Incursions FY17-19 Avg FY22 FY23 %Change 391 299 362 21.1% Airport ATL BOS FY17-19 Avg 18 27 FY22 16 FY23 14 Airport LAX 30 21 LGA FY17-19 Avg 28 8 FY22 13 FY23 20 5 7 BWI CLT 6 19 4 6 6 5 MCO MDW 2 14 5 28 1 30 DCA 13 14 21 MEM 5 7 11 DEN 11 9 5 MIA 15 8 12 DFW DTW EWR 14 11 10 13 7 14 21 10 6 MSP ORD PHL 18 27 17 7 20 1 11 24 8 FLL HNL 7 21 4 13 4 29 PHX SAN 6 4 9 1 9 5 IAD 6 4 2 SEA IAH 9 6 9 SFO JFK 7 4 11 SLC LAS 16 18 11 TPA *Honolulu is coded as HNL or HCF in the source data. 13 4 7 25 13 25 10 9 15 3 7 2 Source: Federal Aviation Administration, Air Traffic Organization, Safety and Technical Training, Office of Policy and Performance (AJI-3), unpublished Airborne Loss Event data, March 7, 2024. FAA Air Traffic Organization • System Operations Services 27 Air Traffic By the Numbers Incursions by Type at Core 30 Airports, FY2023Airport A B C D E Totals ATL BOS BWI CLT DCA DEN DFW DTW 0 0 0 0 0 0 0 0 0 2 1 0 0 0 0 0 5 11 4 2 9 4 10 3 9 8 1 3 12 1 11 7 0 0 0 0 0 0 0 0 14 21 6 5 21 5 21 10 EWR FLL 0 0 0 0 4 3 2 1 0 0 6 4 HNL IAD IAH JFK LAS LAX LGA MCO MDW MEM MIA 0 0 0 0 0 0 0 0 0 0 0 0 0 0 1 0 0 0 0 0 1 0 23 2 5 4 6 12 6 1 9 1 7 6 0 4 6 5 8 1 0 21 9 5 0 0 0 0 0 0 0 0 0 0 0 29 2 9 11 11 20 7 1 30 11 12 MSP ORD PHL 0 0 0 0 0 0 7 6 2 4 18 6 0 0 0 11 24 8 PHX SAN 0 1 0 0 4 3 5 1 0 0 9 5 SEA SFO SLC TPA 0 0 0 0 0 3 0 0 6 14 10 0 1 8 5 2 0 0 0 0 7 25 15 2 Category A - A serious incident in which a collision was narrowly avoided. Category B - An incident in which separation decreases and there is a significant potential for collision, which may result in a time critical corrective/evasive response to avoid a collision. Category C - An incident characterized by ample time and/or distance to avoid a collision. Category D - An incident that meets the definition of a runway incursion such as incorrect presence of a single vehicle/person/aircraft on the protected area of a surface designated for the landing and take-off of aircraft of aircraft but with no immediate safety consequences. Category E - An incident in which insufficient or conflicting evidence of the event precludes assigning another category. Source: Federal Aviation Administration, Air Traffic Organization, Safety and Technical Training, Office of Policy and Performance (AJI-3), unpublished Airborne Loss Event data, March 7, 2024. FAA Air Traffic Organization • System Operations Services 28 Air Traffic By the Numbers Loss of Standard Separation Count, by CenterStandard separation is a specified separation minima between airborne aircraft in controlled airspace. Breaches of such minima are based on airborne loss event data. Losses of standard separation are reported by Air Route Traffic Control Center (ARTCC). Across all centers, the number of losses of standard separation rose from 961 in FY2022 to 1,026 in FY2023. Before the pandemic (FY2017-2019), the average annual number of losses of standard separation was higher at 1,221 (table below). This means losses of standard separation remain below pre-pandemic levels. In FY2023, the centers with the highest losses of standard of separation were Atlanta (ZTL), Los Angeles (ZLA), and Jacksonville (ZJX). The number of losses of standard of separation exceeded pre-pandemic levels at one center (Denver (ZDV)) and three CCF’s (Honolulu (HCF)), Guam (ZUA), and San Juan (ZSU) (graph and table below). (See, Appendix I for explanations of the ARTCC and combined control facilities (CCF).) Total Losses of Standard Separation FY17-19 Avg FY22 FY23 %Change 1,221 961 1,026 6.8% Center HCF JCF ZAB ZAN ZAU ZBW ZDC ZDV ZFW ZHU ZID ZJX ZKC FY17-19 Avg 24 2 57 13 37 31 80 64 74 48 59 91 33 FY22 8 7 62 10 28 18 65 61 43 27 47 81 24 FY23 48 6 57 7 23 19 68 66 63 33 39 83 17 Center ZLA ZLC ZMA ZME ZMP ZNY ZOA ZOB ZSE ZSU ZTL ZUA FY17-19 Avg 104 71 66 48 18 50 60 32 28 14 114 3 FY22 78 73 52 42 8 14 32 26 26 1 125 3 FY23 92 61 43 47 5 27 44 26 26 7 110 9 Source: Federal Aviation Administration, Air Traffic Organization, Safety and Technical Training, Office of Policy and Performance (AJI-3), unpublished Airborne Loss Event data, March 7, 2024. FAA Air Traffic Organization • System Operations Services 29 Air Traffic By the Numbers Section 6. Other ATO TopicsThere are a variety of other aspects of the NAS which are of special interest. This report presents the following: Flight Service Stations Commercial Space Launch Activity FAA Air Traffic Organization • System Operations Services 30 Air Traffic By the Numbers Flight Service Stations Flight services are delivered nationwide through certified professional controllers in Alaska and the contiguous United States, Hawaii, and Puerto Rico. Services include preflight weather briefings, flight planning, inflight advisory services, search and rescue (SAR), and processing notices to air missions (NOTAMs). Self-briefing and other automated services are provided through an online web portal. Web services include interactive graphical capabilities to view a wide range of weather and aeronautical information, flight planning, activating and closing flight plans, and more. Pilots may also access automated voice services to receive current and forecast conditions at specific airports, and receive updates for adverse conditions, including TFRs. Flight Service also delivers the FAA Weather Camera Program. This program features an expanding network of over 400 camera sites in Alaska, Colorado, and Montana (other sites, including Hawaii) and over 200 sites hosted by NAV Canada, Canada's civil air navigation service provider. The weather cameras website provides pilots with additional information for improved situational awareness and decision-making. On the website, pilots can see current images at specific locations, compare the images to clear day views, or playback a loop of past images to establish weather trends. The website also delivers a variety of safety of flight information including adverse conditions, current and forecast conditions, pilot reports, and aeronautical information. ALASKA FSS Barrow FSS (BRW) Cold Bay FSS (CDB) Deadhorse FSS (SCC) Dillingham FSS (DLG) Fairbanks FSS (FAI) Homer FSS (HOM) Iliamna FSS (ILI) Juneau FSS (JNU) Kenai FSS (ENA) Ketchikan FSS (KTN) Kotzebue FSS (OTZ) McGrath FSS (MCG) Nome FSS (OME) Northway FSS (ORT) Palmer FSS (PAQ) Sitka FSS (SIT) Talkeetna FSS (TKA) FEDERAL CONTRACT FSS Leidos FCFSS Washington Hub (DCA) Leidos FCFSS Fort Worth Hub (FTW) FAA Air Traffic Organization • System Operations Services 31 Air Traffic By the Numbers FAA Flight ServicesFAA Facilities – Alaska Flight Service Year Pilot Briefs Flight Plans Filed Preflight Calls Aircraft Contacts Airport Advisories NOTAMs Issued Total SAR FY 2018 89,592 210,626 52,200 521,048 325,140 158,003 4,869 FY 2019 92,070 209,024 52,980 542,550 327,130 166,848 6,924 FY 2020 71,570 141,492 39,031 400,181 243,844 166,954 3,021 FY 2021 67,999 151,946 37,339 445,942 280,499 180,364 3,099 FY 2022 66,580 167,969 36,111 456,727 292,734 166,065 2,736 FY 2023 65,793 162,464 29,569 471,599 298,604 168,694 2,981 Federal Contract Flight Services Year Pilot Briefs Flight Plans Filed Preflight Calls Inflight Contacts Flight Data Calls NOTAMs Issued Total SAR FY 2018 797,746 462,207 1,255,510 286,392 178,110 216,249 9,337 FY 2019 747,731 387,694 1,158,005 257,701 166,546 200,192 9,728 FY 2020 541,004 195,635 782,145 175,361 121,118 179,612 13,195 FY 2021 483,675 168,094 660,369 186,628 125,186 190,118 33,769 FY 2022 422,210 156,629 564,291 179,414 118,296 184,105 33,313 FY 2023 397,290 128,408 525,776 131,373 115,174 166,416 33,604 Web Services/DUATs Year Pilot Briefs* Flight Plans Filed FY 2018 26,349,042 2,229,961 FY 2019 18,946,978 1,690,246 FY 2020 17,290,280 1,272,098 FY 2021 15,550,689 1,328,714 FY 2022 13,639,661 957,148 FY 2023 3,298,272 699,332 * Represents the number of hits to contract web services including DUATs (DUATs decommissioned May, 2018). United States NOTAM Office (USNOF) Year Domestic International FY 2018 1,569,386 874,091 FY 2019 1,670,499 969,951 FY 2020 1,474,047 873,025 FY 2021 1,620,681 953,125 FY 2022 1,644,074 993,139 FY 2023 1,503,507 896,112 Sources: FAA, Air Traffic Organization, Flight Service (AJR-B), Email communication, March 11, 2024; FAA, Air Traffic Organization, U.S. NOTAM Office (AJV-A370), Calculations based on email communication, February 13, 2024. FAA Air Traffic Organization • System Operations Services 32 Air Traffic By the Numbers Commercial Space Launch ActivityDuring CY2023, the FAA licensed 117 U.S. orbital commercial space launches. These launches were carried out by the following companies: SpaceX, 94 launches; Rocket Lab, 10 (7 of which from New Zealand); Virgin Galactic, 6; Blue Origin, 1; Orbital, 1 (part of Northrup Grumman Innovation Systems as of 2018); Firefly, 1; United Launch Alliance, 1; ABL Space Systems, 1; Relativity Space Inc., 1; and Virgin Orbit, 1. A graph showing annual numbers of commercial launches, by company, appears below. Note: A commercial launch is a launch that is internationally competed (i.e., available in principle to international launch providers) or whose primary payload is commercial in nature. FAA-licensed launches carrying captive government (NASA and DOD) or industry payloads are counted here. Data for 2018-2023 include launch failures and successes, and subspace and suborbital launches. Sources: Federal Aviation Administration, Commercial Space Transportation (AST), The Annual Compendium of Commercial Space Transportation, various years; FAA, Commercial Space Transportation (AST), Launches, as of January 3, 2023. https://www.faa.gov/data_research/commercial_space_data/launches/?type=license; U.S. Dept. of Transportation, Bureau of Transportation Statistics, National Transportation Statistics, Table 1-39, January 17, 2019. https://www.bts.gov/browse-statistical-products-and-data/national-transportation-statistics/national-transportation-8 U.S. SpaceportsU.S. commercial space launches are carried out from FAA-licensed spaceports located throughout the country. As of February 4, 2024, there were 14 active FAA-licensed commercial spaceports. For a map of these locations, and to learn more about U.S. spaceports, please consult the FAA Office of Spaceports web page at: https://www.faa.gov/space/office_spaceports FAA Air Traffic Organization • System Operations Services 33 Air Traffic By the Numbers Appendix I. Facility CodesCore 30 Airports (Source: System Data and Infrastructure Group, Office of Performance Analysis, Systems Operations Services, Air Traffic Organization, FAA (AJR-G2).) Code ATL BOS BWI CLT DCA DEN DFW DTW EWR FLL HNL IAD IAH JFK LAS Airport Hartsfield-Jackson Atlanta International Boston Logan International Baltimore/Washington International Charlotte Douglas International Ronald Reagan Washington National Denver International Dallas-Fort Worth International Detroit Metropolitan Wayne County Newark Liberty International Fort Lauderdale/Hollywood International Honolulu International Washington Dulles International George Bush Houston Intercontinental New York John F. Kennedy International Las Vegas McCarran International Code LAX LGA MCO MDW MEM MIA MSP ORD PHL PHX SAN SEA SFO SLC TPA Airport Los Angeles International New York LaGuardia Orlando International Chicago Midway Memphis International Miami International Minneapolis/St. Paul International Chicago O`Hare International Philadelphia International Phoenix Sky Harbor International San Diego International Seattle/Tacoma International San Francisco International Salt Lake City International Tampa International Stand-Alone Terminal Radar Control (TRACON) Facilities* LocID A11 A80 A90 C90 D01 D10 D21 F11 I90 L30 M03 M98 N90 TRACON Anchorage TRACON Atlanta TRACON Boston TRACON Chicago TRACON Denver TRACON Dallas-Fort Worth TRACON Detroit TRACON Central Florida TRACON Houston TRACON Las Vegas TRACON Memphis TRACON Minneapolis TRACON New York TRACON LocID NCT TRACON Northern California TRACON P31 Pensacola TRACON P50 Phoenix TRACON P80 Portland TRACON PCT Potomac TRACON R90 Omaha TRACON S46 Seattle TRACON S56 Salt Lake City TRACON SCT Southern California TRACON T75 St Louis TRACON U90 Tucson TRACON Y90 Yankee TRACON *Cape Cod (K90) merged with Boston TRACON (A90); Meridian (NMM) is now a military, not a civilian TRACON. Air Route Traffic Control Centers (ARTCC) and Combined Control Facilities (CCF) LocID HCF JCF ZAB ZAN ZAU ZBW ZDC ZDV ZFW ZHU ZID ZJX ZKC Center Honolulu Control Facility Joshua Tree Control Facility Albuquerque NM ARTCC Anchorage AK ARTCC Chicago IL ARTCC Nashua NH ARTCC (Boston) Leesburg VA ARTCC (DC) Denver CO ARTCC Fort Worth TX ARTCC Houston TX ARTCC Indianapolis IN ARTCC Jacksonville FL ARTCC Kansas City KS ARTCC LocID ZLA Center Los Angeles CA ARTCC ZLC Salt Lake City UT ARTCC ZMA Miami FL ARTCC ZME Memphis TN ARTCC ZMP Minneapolis MN ARTCC ZNY New York NY ARTCC ZOA Oakland CA ARTCC ZOB Cleveland OH ARTCC ZSE Seattle WA ARTCC ZSU San Juan PR Control Facility ZTL Atlanta GA ARTCC ZUA Guam Control Facility FAA Air Traffic Organization • System Operations Services 34 Air Traffic By the Numbers Appendix II. Other FAA Airport Lists In addition to the Core 30 airports, FAA also uses several other airport lists, including ASPM 77, OEP 35, and OPSNET 45 airports and 34 Select TRACONs. ASPM 77 Airports This is an FAA list of 77 airports, including the Core 30, OEP 35, and other airports. The ASPM (Aviation System Performance Metrics) data includes flights to and from the 77 ASPM airports and all flights by ASPM carriers, as well as flights by those carriers to international and domestic non-ASPM airports. (Source: System Data and Infrastructure Group, Office of Performance Analysis, Systems Operations Services, Air Traffic Organization, FAA (AJR-G2).) (See, Appendix I for the list of Core 30 airports. For OEP 35 airports, see the OEP 35 airport list on the next page.) Code Airport ABQ Albuquerque International Sunport ANC Ted Stevens Anchorage International ATL Hartsfield-Jackson Atlanta International AUS Austin-Bergstrom International BDL Bradley International BHM Birmingham International BNA Nashville International BOS Boston Logan International BUF Buffalo Niagara International BUR Bob Hope (Burbank/Glendale/Pasadena) BWI Baltimore/Washington International CLE Cleveland Hopkins International CLT Charlotte Douglas International CVG Cincinnati/Northern Kentucky International DAL Dallas Love Field DAY Dayton International DCA Ronald Reagan Washington National DEN Denver International DFW Dallas/Fort Worth International DTW Detroit Metropolitan Wayne County EWR Newark Liberty International FLL Fort Lauderdale/Hollywood International GYY Gary Chicago International HNL Honolulu International HOU Houston Hobby HPN Westchester County IAD Washington Dulles International IAH George Bush Houston Intercontinental IND Indianapolis International ISP Long Island Mac Arthur JAX Jacksonville International JFK New York John F. Kennedy International LAS Las Vegas McCarran International LAX Los Angeles International LGA New York LaGuardia LGB Long Beach MCI Kansas City International MCO Orlando International MDW Chicago Midway Code Airport MEM Memphis International MHT Manchester MIA Miami International MKE Milwaukee General Mitchell International MSP Minneapolis/St. Paul International MSY Louis Armstrong New Orleans International OAK Oakland International OGG Kahului OMA Omaha Eppley Airfield ONT Ontario International ORD Chicago O’Hare International OXR Oxnard PBI Palm Beach International PDX Portland International PHL Philadelphia International PHX Phoenix Sky Harbor International PIT Pittsburgh International PSP Palm Springs International PVD Providence Francis Green State RDU Raleigh/Durham International RFD Greater Rockford RSW Southwest Florida International SAN San Diego International SAT San Antonio International SDF Louisville International SEA Seattle/Tacoma International SFO San Francisco International SJC Norman Mineta San Jose International SJU San Juan Luis Munoz International SLC Salt Lake City International SMF Sacramento International Airport SNA John Wayne Airport-Orange County STL Lambert Saint Louis International SWF Stewart International TEB Teterboro TPA Tampa International TUS Tucson International VNY Van Nuys FAA Air Traffic Organization • System Operations Services 35 Air Traffic By the Numbers OEP 35 Airports This is an FAA list of 35 commercial U.S. airports with significant air traffic. These airports serve major metropolitan areas and some also serve as hubs for airline operations. The OEP 35 (Operational Evolution Partnership) is made up of the Core 30, plusfive other airports. In 2005, this list was replaced by the Core 30 list. (Source: System Data and Infrastructure Group, Office of Performance Analysis, Systems Operations Services, Air Traffic Organization, FAA (AJR-G2). https://aspm.faa.gov/aspmhelp/index/OEP_35.html.) (See, Appendix I for the list of Core 30 airports.) Code ATL BOS BWI CLE CLT CVG DCA DEN DFW DTW EWR FLL HNL IAD IAH JFK LAS LAX Airport Hartsfield-Jackson Atlanta International Boston Logan International Baltimore/Washington International Cleveland Hopkins International Charlotte Douglas International Cincinnati/Northern Kentucky International Ronald Reagan Washington National Denver International Dallas/Fort Worth International Detroit Metropolitan Wayne County Newark Liberty International Fort Lauderdale/Hollywood International Honolulu International Washington Dulles International George Bush Houston Intercontinental New York John F Kennedy International Las Vegas McCarran International Los Angeles International Code Airport LGA New York LaGuardia MCO Orlando International MDW Chicago Midway MEM Memphis International MIA Miami International MSP Minneapolis/St Paul International ORD Chicago O`Hare International PDX Portland International PHL Philadelphia International PHX Phoenix Sky Harbor International PIT Pittsburgh International SAN San Diego International SEA Seattle/Tacoma International SFO San Francisco International SLC Salt Lake City International STL Lambert Saint Louis International TPA Tampa International OPSNET 45 Airports The FAA list of OPSNET 45 airports appear below. In the late 1990s, these were airports that contributed to 75 percent of NAS delays and that each had 500 or more operations per day. (Note, by FY2019, the number of OPSNET 45 airports with at least 500 operations per day fell to 36 airports.) Code Airport ABQ Albuquerque International Sunport ATL Hartsfield-Jackson Atlanta International BNA Nashville International BOS Boston Logan International BWI Baltimore/Washington International CLE Cleveland Hopkins International CLT Charlotte Douglas International CVG Cincinnati/Northern Kentucky International DCA Ronald Reagan Washington National DEN Denver International DFW Dallas/Fort Worth International DTW Detroit Metropolitan Wayne County EWR Newark Liberty International FLL Fort Lauderdale/Hollywood International HOU Houston Hobby IAD Washington Dulles International IAH George Bush Houston Intercontinental IND Indianapolis International JFK New York John F Kennedy International LAS Las Vegas McCarran International LAX Los Angeles International LGA New York LaGuardia MCI Kansas City International Code Airport MCO Orlando International MDW Chicago Midway MEM Memphis International MIA Miami International MSP Minneapolis/St Paul International MSY Louis Armstrong New Orleans International OAK Oakland International ORD Chicago O`Hare International PBI Palm Beach International PDX Portland International PHL Philadelphia International PHX Phoenix Sky Harbor International PIT Pittsburgh International RDU Raleigh/Durham International SAN San Diego International SEA Seattle/Tacoma International SFO San Francisco International SJC Norman Mineta San Jose International SLC Salt Lake City International STL Lambert Saint Louis International TEB Teterboro TPA Tampa International FAA Air Traffic Organization • System Operations Services 36 Air Traffic By the Numbers 34 Select TRACONs The 34 Select are the TRACONs support the OPSNET 45 airports. (See, above for the list of OPSNET 45 airports.) (Source: System Data and Infrastructure Group, Office of Performance Analysis, Systems Operations Services, Air Traffic Organization, FAA (AJR-G2). https://aspm.faa.gov/aspmhelp/index/34_Select.html) LocID A80 A90 ABQ BNA C90 CLE CLT CVG D01 D10 D21 I90 IND L30 M98 MCI MCO TRACON Atlanta TRACON Boston TRACON Albuquerque International Nashville International Chicago TRACON (Elgin) Cleveland Hopkins International Charlotte/Douglas International Covington/Cincinnati International Denver TRACON Dallas/Ft Worth TRACON Detroit TRACON Houston TRACON Indianapolis International Las Vegas TRACON Minneapolis TRACON Kansas City International Orlando International LocID MEM MIA MSY N90 NCT P50 P80 PBI PCT PHL PIT RDU S46 S56 SCT T75 TPA TRACON Memphis International Miami International New Orleans International/Moisant New York TRACON Northern California TRACON Phoenix TRACON Portland TRACON Palm Beach International Potomac TRACON Philadelphia International Pittsburgh International Raleigh Durham International Seattle/Tacoma TRACON Salt Lake City TRACON Southern California TRACON St Louis TRACON Tampa International FAA Air Traffic Organization • System Operations Services 37 Air Traffic By the Numbers Appendix III. Historical Airport and Center Operations Airport Operations A graph displaying historical annual airport control tower operations data for 1946-2023 appear below. Included are calendar year data for 1946-1976 and fiscal year data for 1977-2023. Airport towers consist of FAA facilities, not including contract towers, and represent the number of arrivals and departures from the airport at which the airport traffic control tower is located. (Data for 1946-1990 were originally published in the CAA Statistical Handbook of Civil Aviation and the successor publication FAA Statistical Handbook of Aviation. Data for 1991 onward come from the FAA OPSNET database.) In FY2023, airport operations amounted to 37.3 million, rising by 3.2 percent, from 36.1 million in FY2022 (below). Such operations peaked 43 years earlier, in FY1979, at 69 million. (The decrease since the FY1979 peak was mainly due a decrease in general aviation (GA) operations, which fell from 51.7 million in FY1979 to 15.6 million in FY2023 (not shown below)). Sources: 1946-1963: Civil Aeronautics Administration, CAA Statistical Handbook of Civil Aviation, various; 1964-1990: Federal Aviation Administration, FAA Statistical Handbook of Aviation, various; 1991-present: Federal Aviation Administration, Air Traffic Organization, Office of Performance Analysis (AJR-G), Operations Network (OPSNET), April 19, 2024. FAA Air Traffic Organization • System Operations Services 38 Air Traffic By the Numbers Center Operations Historical annual center operations for 1


No comments:
Post a Comment